EU PROJECTBringing an innovative pocket-sized 12-lead ECG with AI-automated interpretation to the market: AnyECG project. CLINICAL STUDYCardiolyse Risk of Heart Disorders score predicts heart failure outcomes in the MyoVasc study DEVICE INTEGRATIONCardiolyse and MedicubeX deepen their collaboration CLINICAL PILOTPost-ablation telemonitoring with GVM Care & Research at Maria Cecilia Hospital HOSPITAL PILOTCardiolyse improves cardiovascular care at Oxford University Hospitals EU PROJECTCRANE: pre-commercial procurement for remote chronic care

Holter ECG Analytics

AI analysis for 1- to 3-lead Holter recordings.

Cardiolyse analyses 1- to 3-channel Holter recordings beat by beat. It counts every beat, classifies rhythms and ectopic beats, flags tachycardia and bradycardia runs, measures intervals and scores signal quality — across the full recording.

A nurse attaching three colour-coded ECG electrodes connected to a compact Holter recorder to a patient's chest.
3-lead Holter · every beat analysed
1–3 leads
Single- to 3-channel Holter recordings
0
Rhythm and beat findings classified
0
Intervals measured: P-wave, PR/PQ, QRS, QT
Per beat
Signal-quality and confidence scoring
What the analysis returns

Hours of signal in. A structured Holter read out.

Each 1- to 3-lead recording is processed from start to finish. Results come back as counts, findings, events and measurements that a qualified healthcare professional can review and confirm.

Beat detection

QRS detection
Total beat count across the full recording.

Rhythm classification

Normal sinus rhythm (NSR)
Baseline sinus rhythm identification.
Atrial fibrillation (AFib)
Irregular atrial rhythm detection.
1st-degree AV block
Prolonged AV conduction detection.
Premature ventricular contraction (PVC)
Ectopic ventricular beat detection.
Premature atrial contraction (PAC)
Ectopic atrial beat detection.
Tachy-brady pattern
Alternating tachycardia and bradycardia episodes.
Pause
Sinus pause detection.

Rate-based events

Tachycardia run
Tachycardia episode · rate above configured threshold
Bradycardia run
Bradycardia episode · rate below configured threshold

Heart rate summary

HR min / max / average
Summary heart rate statistics across the recording.

Interval analysis

P-wave duration
Atrial depolarisation duration.
PR / PQ interval
Atrioventricular conduction time.
QRS duration
Ventricular depolarisation duration.
QT interval
Ventricular depolarisation and repolarisation duration.

Signal quality

Artifact / noise detection
Identification of non-physiological signal segments.
Beat quality / signal quality score
Per-beat confidence scoring.

From recording to insights

Every beat counted. Every run flagged.

Long recordings capture the full picture. The analysis walks the whole signal, labels each beat and marks the stretches that meet event criteria — while noisy segments are identified rather than counted as rhythm.
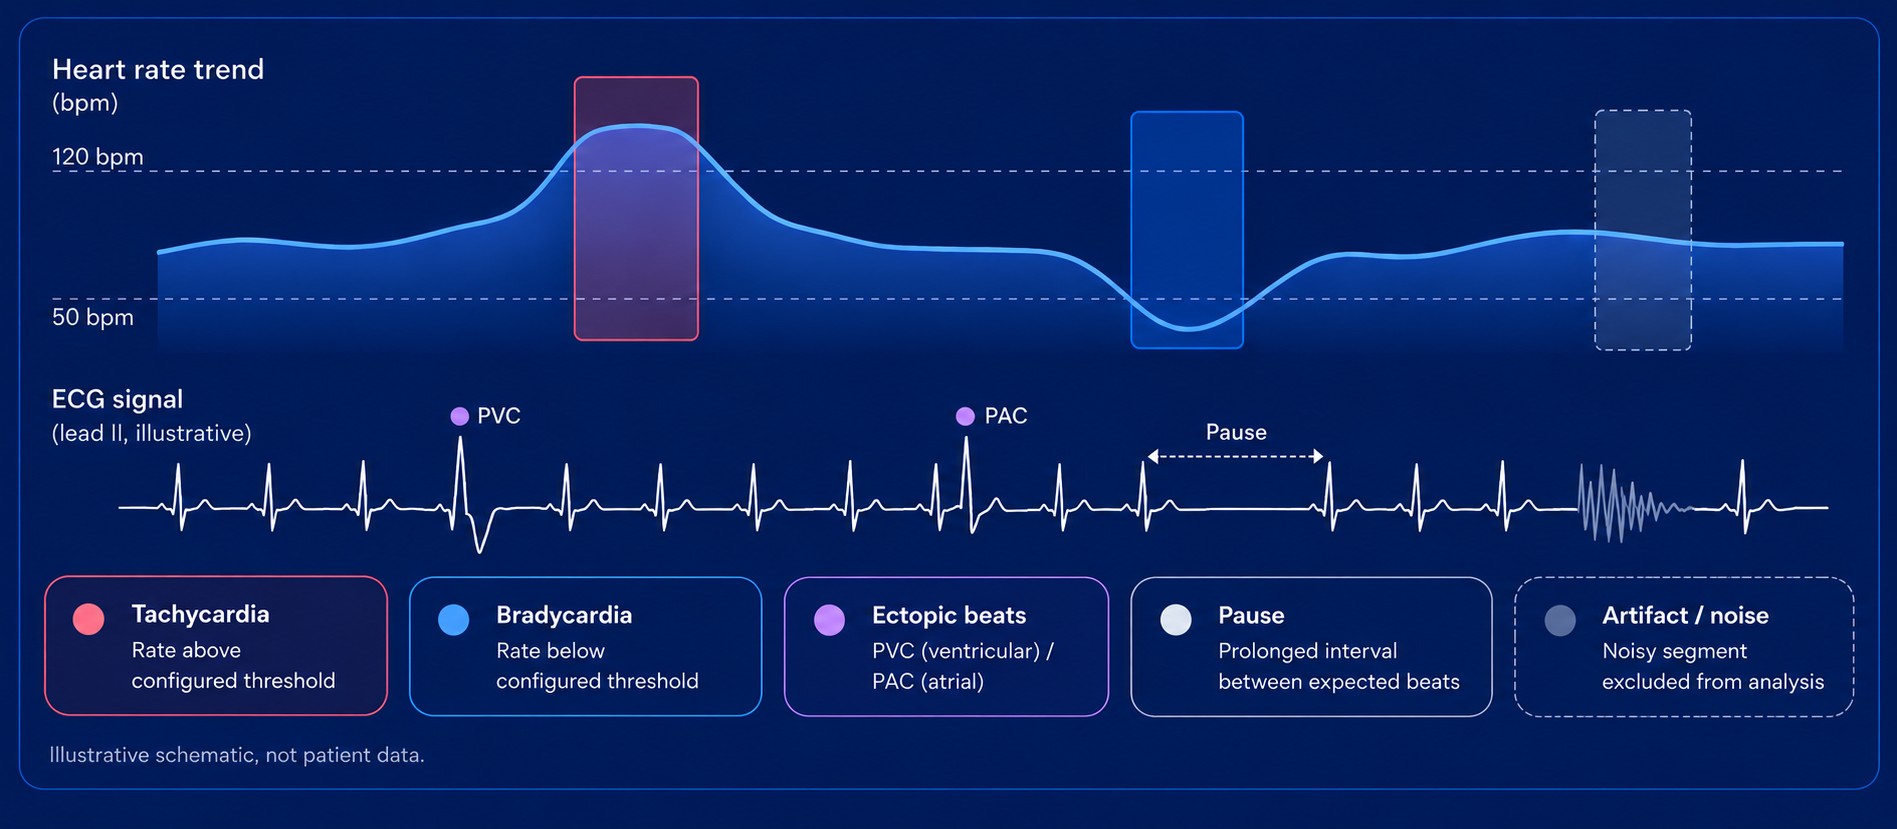
Illustrative Holter schematic: heart-rate trend with tachycardia, bradycardia and noise segments above an ECG signal marking a PVC, a PAC, a pause and an artifact, with a legend for tachycardia, bradycardia, ectopic beats, pause and artifact or noise.
How it works

From a Holter recording to a structured result.

  1. 01

    Record

    The patient wears a 1- to 3-lead Holter recorder or ECG patch for the monitoring period your service defines.

  2. 02

    Upload

    The recording is sent to Cardiolyse through the REST API or a partner integration.

  3. 03

    Analyse

    Beats are detected and classified, rate-based events flagged, intervals measured and signal quality scored across the full recording.

  4. 04

    Results

    Findings return as structured data and a report, ready for review by a qualified healthcare professional in your own system.

Technical fit

Built for Holter services and device partners.

Designed to sit behind recorders, patches and monitoring services, so analysis happens in the background and results land where your team already works.

Inputs
1–3 lead ECG
  • Single-, 2- and 3-channel Holter recordings
  • Ambulatory recorders and ECG patches
  • Device-agnostic digital signal input
Outputs
Structured Holter read
  • Beat count and beat classification
  • Rhythm findings and rate-based events
  • HR min / max / average and intervals
  • Artifact segments and per-beat quality score
  • JSON via REST API and PDF report
Deployment
API-first
  • EU-hosted managed service
  • OEM and white-label options
  • Batch processing of recordings
  • Documented ECG API & Integration
Who uses it

For teams that analyse long ECG recordings at scale.

Monitoring services

Holter and remote-monitoring providers

Give every recording a consistent first analysis, so reviewers start from counted beats, flagged events and measured intervals.

Device manufacturers

Recorder, patch and wearable makers

Add beat-level Holter analytics for 1- to 3-lead devices through one API, under your brand.

Research

Clinical studies and research groups

Analyse ambulatory ECG data with the same criteria across every participant and site, with results as structured data.

Frequently asked

Holter ECG analytics, answered.

Which Holter recordings can Cardiolyse analyse?

Holter ECG analytics is built for 1- to 3-lead recordings — single-channel patches and 2- or 3-channel Holter recorders. For 12-lead resting ECGs, see Resting ECG Analytics.

What does the analysis detect?

It counts beats (QRS detection) and identifies normal sinus rhythm, atrial fibrillation, 1st-degree AV block, premature ventricular and atrial contractions, tachy-brady patterns and sinus pauses. It also measures P-wave duration, PR/PQ, QRS and QT intervals and summarises heart rate.

How does it handle noise and poor signal?

Artifact and noise detection identifies non-physiological signal segments, and every beat receives a quality and confidence score, so unreliable stretches are visible instead of being counted as rhythm.

How are results delivered?

As structured JSON through the REST API and as a PDF report, so they can be shown in your own platform or monitoring service. Results support qualified healthcare professionals, who review and confirm the findings.

Can we test it on our own recordings?

Yes. Send us a small set of anonymised 1- to 3-lead recordings and we will walk you through the results. Contact us to set it up.

For everything else, see the full FAQ.

See your Holter recordings analysed beat by beat.

Send us a few anonymised 1- to 3-lead recordings — we will analyse them and review the results with you.